

Unlocking Insights Hidden in Contract Rebate Claims
By Ashwin Athri
One of the most under leveraged data sets that pharma has access to is the claims data that PBMs and health plans provide to support invoicing for the rebate agreements. Even though there are a lot of limitations in the data use agreements, there are significant insights, specifically for contract performance evaluation, that can be unlocked with the right management tools and solutions. Let’s explore how you can wrangle these data and go beyond the basic accrual process it is currently being leveraged for.
To do so, we first need to appreciate the key challenges we observe in working with these data
- Each contract with a PBM or health plan results in data that have a unique format, unique IDs, and names that do not adhere to a universal standard. Thus each payer’s data output has significant idiosyncrasies
- The claims and enrolment information are not tied together and come as separate data feeds
- Rarely is the enrolment information digitized. They come in various PDF, word, and image formats making it hard to assess and integrate
- The plan name and IDs can change over time with each submission making it difficult to perform consistent reporting and analytics
- There is varied granularity in each payer’s submissions
- Some come with formulary level data, some don’t
- Some have payer and plan IDs collapsed, some don’t
- Some have plan names in the plan IDs and some don’t
These challenges make it very difficult to generate consistent insight to support contracting reporting and analytics. The end result is significant time spent by analytic staff who have to curate data for a specific analysis and then repeat that process for each use case. This is not only inefficient, but also comes with potential for errors, loss of granularity, and the opportunity cost of leveraging analytics staff for actual insights rather than data management.
Nonetheless, regardless of how messy the data is, it is still one of the most insightful sources of data about payers that pharmaceutical manufactures receive directly from the health plans. By employing the appropriate data management tools and solutions, we can better equip the finance and market access teams to derive the vital insights hidden in the rough in a consistent manner.
The first step is to normalize all the names and IDs being received across all the contracts the manufacturer has. To do so, we must leverage a payer master with which to relate claims that the data payer dimensions are bridged to.
As the Formulary, Plans, Payers, PBMs and their relationships exist as entities in the real-world, they are not dependent on a specific drug, therapeutic class, or manufacturer. The first step is to leverage a payer master that is built agnostic to a data source and represents the accounts the way they are. This is a problem solved that does not need to be tackled again.
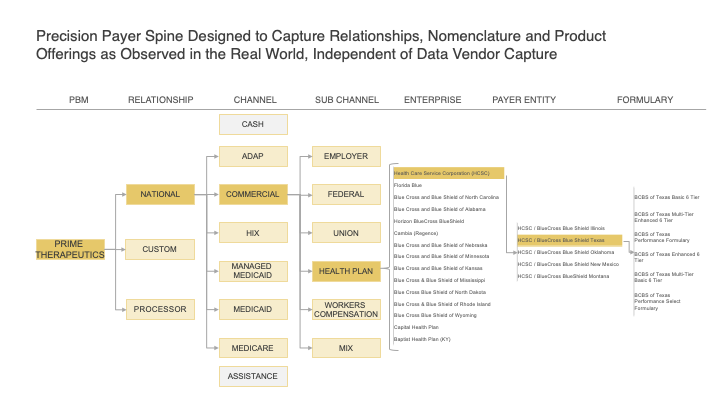
Figure 1: Payer Master Example for Prime Therapeutics with relevant Granularity and Accuracy in representing Accounts
The second step is to digitize the enrolment information into a consistent dataset. The key extract from these files are
- The formulary names that are associated with a formulary ID. The claims only come with a formulary ID and no associated name. By creating this translation from ID to name, we unlock significant value
- The enrolment lives by formulary ID. This is a great source of covered lives information at the formulary level direct from the source
- For the limitations in the data use agreements, we can scrub the new data set of the client list that are available along with the enrolment information
Once we have established a robust payer master and digitized the enrolment files, we can start the third step to bridge all the plan names, IDs, and formulary codes that we observe across all payer and PBM contract rebate submission to the payer master at the highest level of granularity.
By creating a unique identifier comprised of Plan ID, Plan Name, Formulary Code, and Submission Quarter, we can bridge it to the corresponding Payer Entity OD from the payer master. Using the newly digitized enrolment data, we can then apply the corresponding formulary name to the claim.
As described in the example below, the fields in blue are what is received from the rebate claims and that in yellow are what they are mastered to.
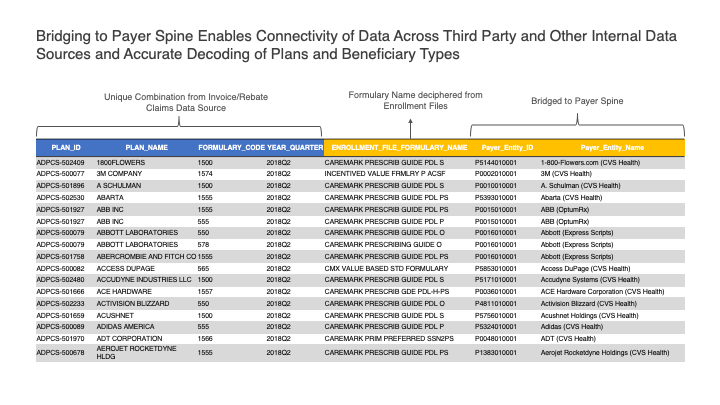
Figure 2: Bridging the rebate claims to the payer spine along with the formulary identification
However, this still leaves us with insufficient information to get to the final bid grid level since the formulary names in the enrolment files are not aligned with the promoted names in the market place. The fourth step is to translate the enrolment-file derived formulary names to the published names and a map of the published formularies to the corresponding bid grid location.
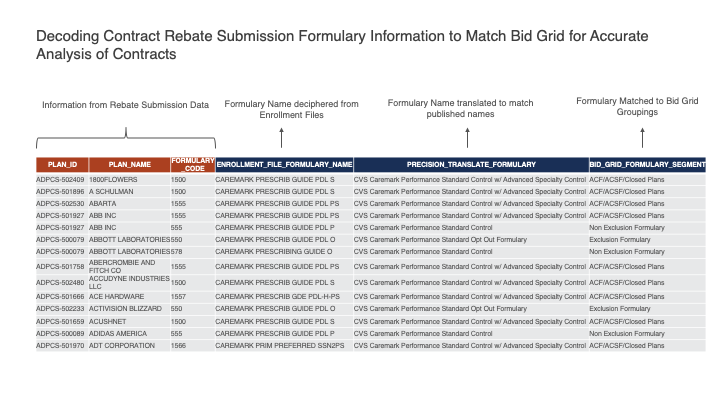
Figure 3: Translating the enrolment file formulary names to published names and positioning them on the bid grid for the account
The significant added benefit of bridging to the payer master is that it now allows us to walk the facts across different sources of data like Formulary Coverage, Transactions, Claims, and Specialty Pharmacy etc to create a complete payer landscape and to enable sophisticated analytics that could not be accomplished otherwise.
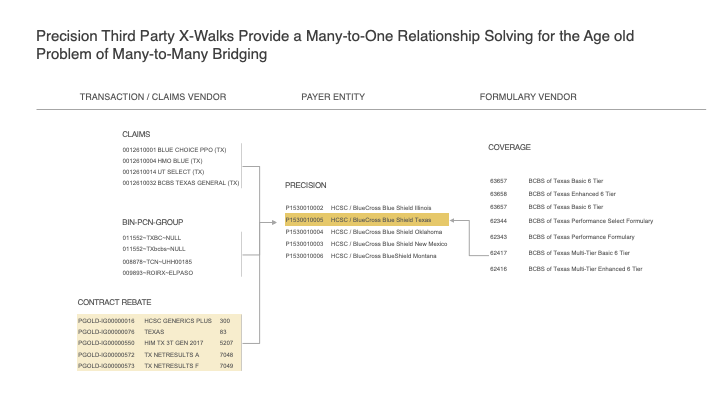
Figure 4: Example of Connecting CONTRACT REBATE values for HCSC/BCBS Texas Commercial to the Payer Master; that also connects to other data sources such as Claims, SPP, COPAY, HUB, and Formulary Data
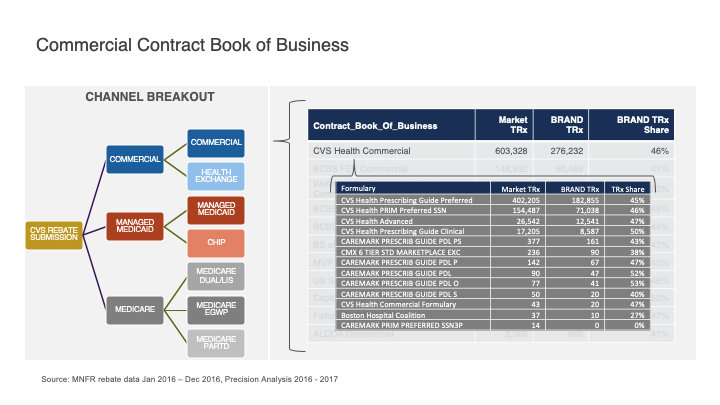
Figure 5: Example of formulary level performance reporting enabled by rebate bridging
Now, we are ready to put into production the rebate claims data to support consistent reporting and analysis! Some of the value additions and use cases that are enabled are
- The only source of formulary level transactions available in the industry
- Ability to better understand the PBM unspecified/administered plan data in third-party sources as we can see the actual formulary level transactions in the rebate claims
- Consistent Market share computations across all contracts
- Ability to compute market share when no competitor information is available from rebate claims by leveraging the bridging to third-party data
- Bid grid level market share calculations with superior insights compared to enrolment lives–based analysis
- What if scenarios and game theory application on prospective contract scenarios
- Compare contract performance within and across accounts based on rebate percentage